UX KPIs are a great way to showcase the progress to shareholders and team members. Depending on the type of product or design or website, each team may choose to track different set of metrics and even define new, more specific KPIs that will help measure UX more effectively. They need to be shaped so the results are easy to quantify.
The UX designer must have a product’s UX benchmark and measured it on a regular basis. Convert your design conclusions into quantitative/qualitative data that have the ability to be measured, tested, and repeated. For this purpose, your project KPIs need to have a greater insight into your user behavior, their issues, and how to solve for them.
With that in mind, here are a few of the Key Performance Indicators.
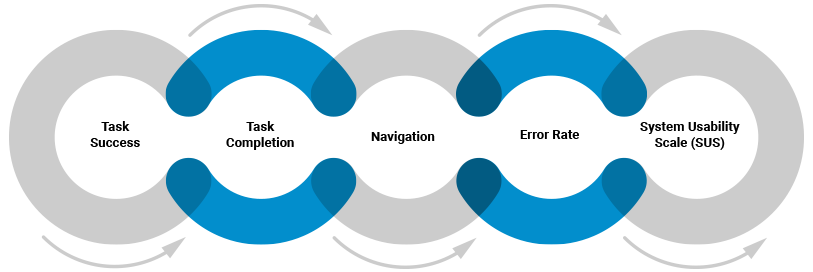
One of the most commonly used KPIs that reflects how users are able to completing certain tasks effectively. Track the progress of the rate that changes through time, when users gain more experience with the service. This will give more understanding of system’s learnability, which is another indicator of user experience success.
Task Completion
This metric is basically the amount of time it takes the user to complete the task, expressed in minutes and seconds. It’s the most common way to measure the effectiveness of an interface by presenting the average time spent on each task. Thumb rule: smaller time-on-task metric, the better user experience.
Navigation
This metric is valuable for evaluating the efficiency of information architecture. Navigation plays a vital role in directing users throughout the website while also helping them acquire the information that they are looking. So, this metric can be tracked by assigning a usability task to find and purchase an item for ecommerce site and track. Another way is setting up a heatmap to visually understand where users are traveling on the website.
Error Rate
Best way of evaluating user performance. This metric let you know the number of mistakes that were made while the users were interacting with products and how different design iterations bring up different errors. By recording unintended action, slip, mistake or omission a user makes while attempting a task we can get excellent product diagnostic information. I agree this is somewhat time consuming to do: need someone to review recordings.
System Usability Scale (SUS)
This metric provides a “quick and dirty”, reliable tool for measuring the usability. It consists of 10 item questionnaires with five response options from Strongly agree to Strongly disagree. The metric has been tried and tested throughout almost 30 years of use, and has proven itself to be a dependable method of evaluating the usability of systems compared to industry standards.


